On personal dashboard you will find these sections:
- Personal overtime
- Today's work time
- Work start (last 30 days)
- Untagged time
- My work history
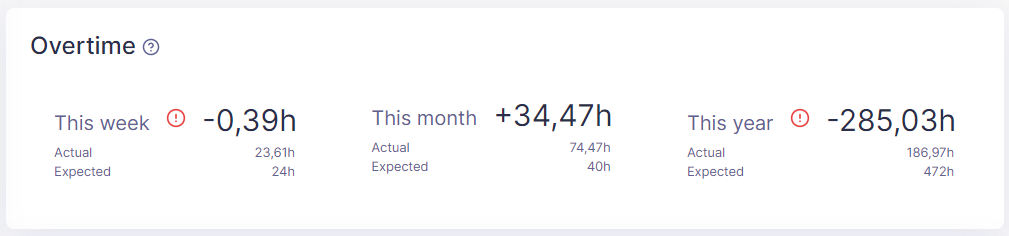
Personal overtime
At the top you will find Overtime information, showing you your overtime for current week, month and year. (Overtime is the difference between Time at work and Expected time)
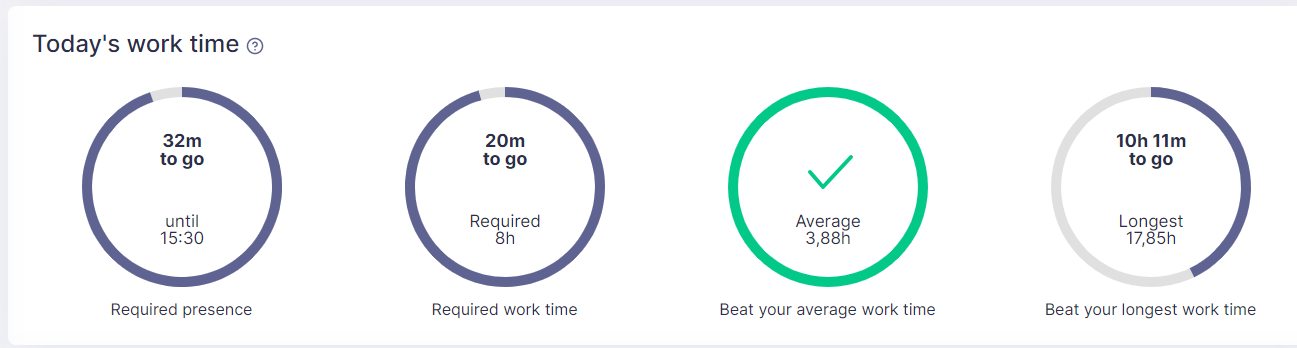
Today's work time
This section shows your daily goals, showing you how much time remains until the goal is achieved.
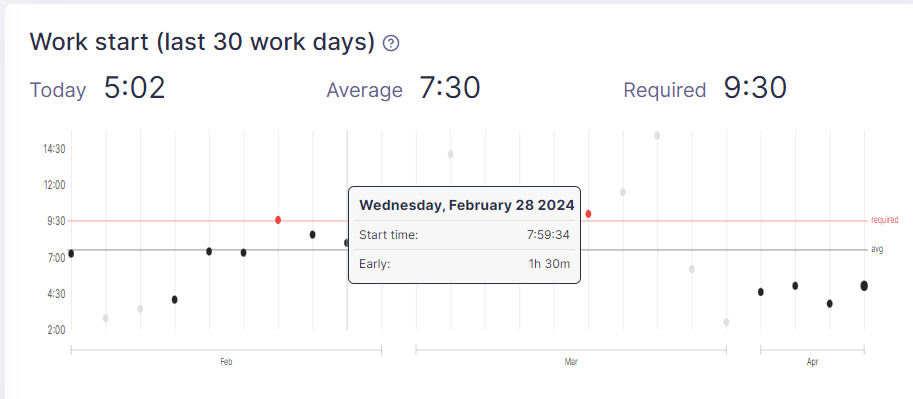
Work start (last 30 days)
Work start chart shows start times for the last 30 days:
- Black dots indicate work days where start time was before required expected time
- Red dots indicate work days when start time was after required expected time
- Grey dots indicate non work days
Untagged time
Untagged time is Active time which is still untagged. The report only shows time when you were active on any device and which was not tagged on any device.
For example if you were active on Mac and this time is already tagged on ManicTime for Windows, then this time will not count as Untagged time. The report will help you to quickly figure out which days are still untagged:
- Filled blue circle - All active time was tagged
- Unfilled blue circle/arc - Not all Active time was tagged. The amount of blue arc corresponds to Active time which was tagged.

My work history
For each day an icon shows you general information about the day:
- Green check - Time at work >= Expected time
- Exclamation icon - Time at work < Expected time
- Right arrow - Leave time
- Grey question mark - Workday without data. Did you forget to tag time or enter leave time?
- Grey diagonal pattern - Weekend
- Blue diagonal pattern - Work free day
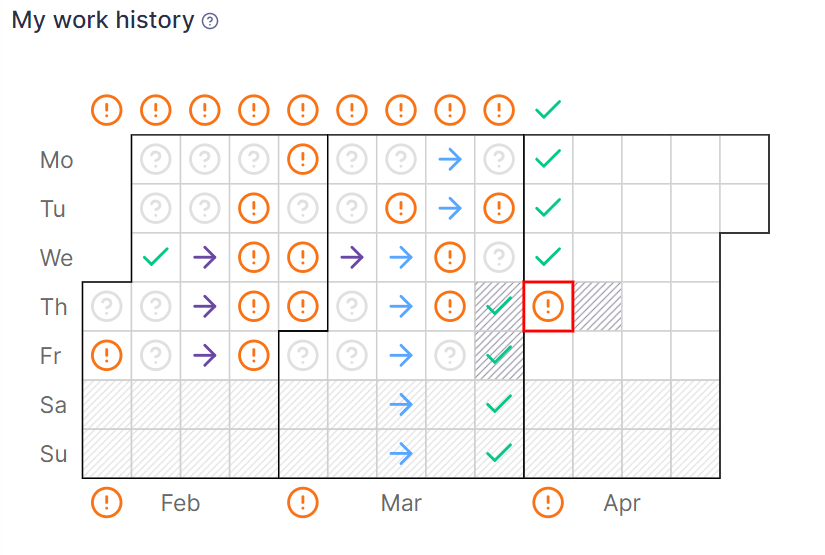
Above the grid, green check or exclamation icon indicates whether time at work >= expected time at work for that week.
Left of the month name, green check or exclamation icon indicates whether time at work >= expected time at work for that month.