All reports follow the same pattern. At the top you can select which data to include and set a date range. By default it is set to all users for today.
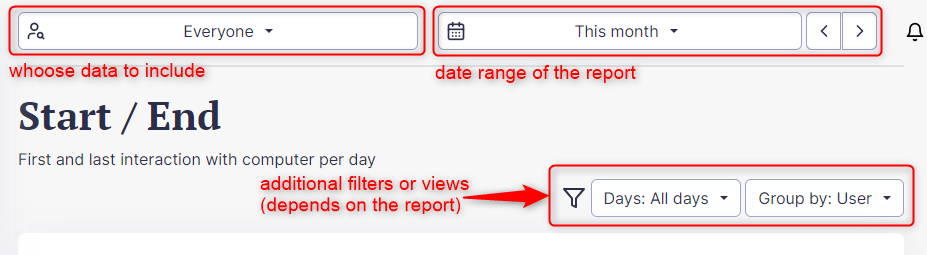
Some reports only work for one day, like Overview and Timelines, so you can only choose one day in Date range. Each report has a short description under the title.
Team reports:
- Dashboard - Overview of data for selected period.
- Daily status - Daily summary of user's activity
- Timelines - Usage data displayed on timelines. On the right you can select which timelines to show. Click on the three dots on the right side of each timeline to see e details.
- Productivity - Productivity is based on selection of productive applications and web sites
- Categories - Applications and websites can be assigned into custom categories in Administration -> Productivity
- Overtime - Showing difference between Actual user work hours per day and Expected user work hours per day. (Configure overtime)
- Workplaces - Shows productivity based on location
- Active time - Computer usage by hour of day
- Start/End - First and last interaction with computer
- Attendance and leave - Showing user active, absent and leave days
- Applications and web sites - Top applications used and web sites visited